

Theory
Activation: finding the aha moment
Find your product's aha moment: the week-one action that separates users who stay from users who leave, and know what that comparison can't prove.
~10 min read · 9 exercises · 250 points
Before you start
When does Halves click?
The Halves onboarding team needs one goal for new users: the moment the app clicks. Maya asks you which action in the first week makes people stay, and expects the answer to come from the data.
In this lesson you'll compare users who did each candidate action in their first week with those who didn't, find the one that best separates those who stay, and learn what that comparison can and can't prove.
Activation: an action plus a time limit
Activation, often called the aha moment, is the point at which a new user first gets the core value of a product. For a goal, it has to be written as something you can count: an action plus a time limit, such as "added three expenses in week 1".

The search method compares later retention:
- pick a later outcome, here active in week 4 (opened the app on days 21–27 after sign-up);
- use only cohorts that have reached it: newer ones are right-censored, as in Reading a funnel: right censoring and date ranges. With data pulled on 31 August, everyone who signed up after 2 August is still short of week 4, so only the 96 July sign-ups have
active_week4filled; - compute the baseline: 33 of 96 were active in week 4, 33 ÷ 96 = 0.344 ≈ 34.4%;
- for each candidate action in week 1, compare retention of users who did it with those who didn't.
The baseline matters because every "did" and "didn't" group splits it. A candidate is interesting when the two groups land far apart on either side of 34.4%.
- DoBaseline: July sign-ups only (week 4 complete): 33 ÷ 96 = 34.4% active in week 4.
- Don'tBaseline over all 192 sign-ups, counting August users without week-4 data as inactive.
Right censoring again: August users haven't reached week 4.
What makes a criterion usable
A team can't aim at "the moment Halves clicks". It can aim at a criterion written in the data's own terms. A usable activation criterion has three parts:
- An observable action, something in the event log: an expense added, an invite accepted, a settle-up. "Understands the value" or "feels confident" are the ideas behind the criterion, not something you can count.
- A threshold, if more than once matters: "at least 3 expenses".
- A time limit, from sign-up: "by day 6". Without it, the criterion is "ever", which grows with cohort age, the same trap as "so far" funnel rates.
Put together: "a second member in the group and at least 3 expenses by day 6 after sign-up". Anyone with the data can check who met it, and the onboarding team can see exactly which behaviour they're trying to make more common.
Keep the criterion short. Every extra condition makes it sharper but narrower, and a criterion that few users can ever meet is a weak goal. That trade-off, separation against reach, is how you choose between candidates.
- Do“Second member and 3+ expenses by day 6 after sign-up.”
- Don't“Added 3 expenses.”
No time limit: older users meet it just by being older.
Comparing a candidate: did vs didn't
For each candidate, split the 96 July users into those who did the action in week 1 and those who didn't, then compute week-4 retention in each group.
Candidate B, a second member in the group by day 6, needs a careful definition first. A user counts if they joined through an invite (channel = invite, so they arrived into a group with someone already in it) or someone accepted their invite by day 6 (invite_accepted_day ≤ 6).
Dataset · 192 rows
Halves new users, 6 July – 30 August 2026
192 sign-ups, data pulled on 31 August. `active_week4` is filled for the 96 July sign-ups.
First 5 of 192 rows
- did B: 51 users (27 invitees + 24 self-signups), 30 active in week 4: 30 ÷ 51 ≈ 58.8%;
- didn't: 45 users, 3 active: 3 ÷ 45 ≈ 6.7%.
The gap is 58.8 − 6.7 = 52.1 percentage points. Candidate A, a first expense in week 1, gives 54.3% against 16.0%, a gap of 38.3.
Two habits keep the comparison honest. Check that did + didn't add up to all 96 users, so nobody fell out of both groups. And write the gap in percentage points, the difference of two percentages, not as a ratio, so candidates can be ranked on one scale.
- DoB: 30 ÷ 51 = 58.8% vs 3 ÷ 45 = 6.7%; gap 52.1 points; 51 + 45 = 96 ✓
- Don'tB: count only
invite_accepted_day≤ 6 and leave invitees out.Invitees had a second member from day 0.
Combining conditions sharpens the gap
Candidate B, a second member in the group by day 6, is about the group: someone else is there to share costs. Candidate C, at least 3 expenses in week 1, is about using it: 72.4% of those users were active in week 4 against 17.9% of the rest. The natural next step is to require both.
Combined candidate: a second member by day 6 and expenses_week1 ≥ 3.
- did both: 25 users, 20 active in week 4: 20 ÷ 25 = 80.0%;
- didn't: 71 users, 13 active: 13 ÷ 71 ≈ 18.3%.
That's a gap of 61.7 points, the best separation so far. It makes sense: a group where people both share and actually log costs is the product working as designed.
But look at the group size. Only 25 of 96 users, 26%, met both conditions. Each condition you add makes the "did" group more selective and its retention higher, partly because you're picking ever more committed users. A sharper criterion is not automatically a better goal; it has to be weighed against how many users it covers and how many more could realistically get there.
- DoBoth: 20 ÷ 25 = 80.0% vs 13 ÷ 71 = 18.3%, reached by 25 ÷ 96 = 26%.
- Don't“80% retention: the combined action is clearly the one.”
Reports the gap without the reach, on a quarter of the users.
Ranking candidates by the gap
Ranking needs one scale. For each candidate, the gap is retention of those who did it minus retention of those who didn't, in percentage points:
- second member and 3+ expenses by day 6: 80.0 − 18.3 = 61.7;
- 3+ expenses in week 1: 72.4 − 17.9 = 54.5;
- second member by day 6: 58.8 − 6.7 = 52.1;
- first expense in week 1: 54.3 − 16.0 = 38.3.
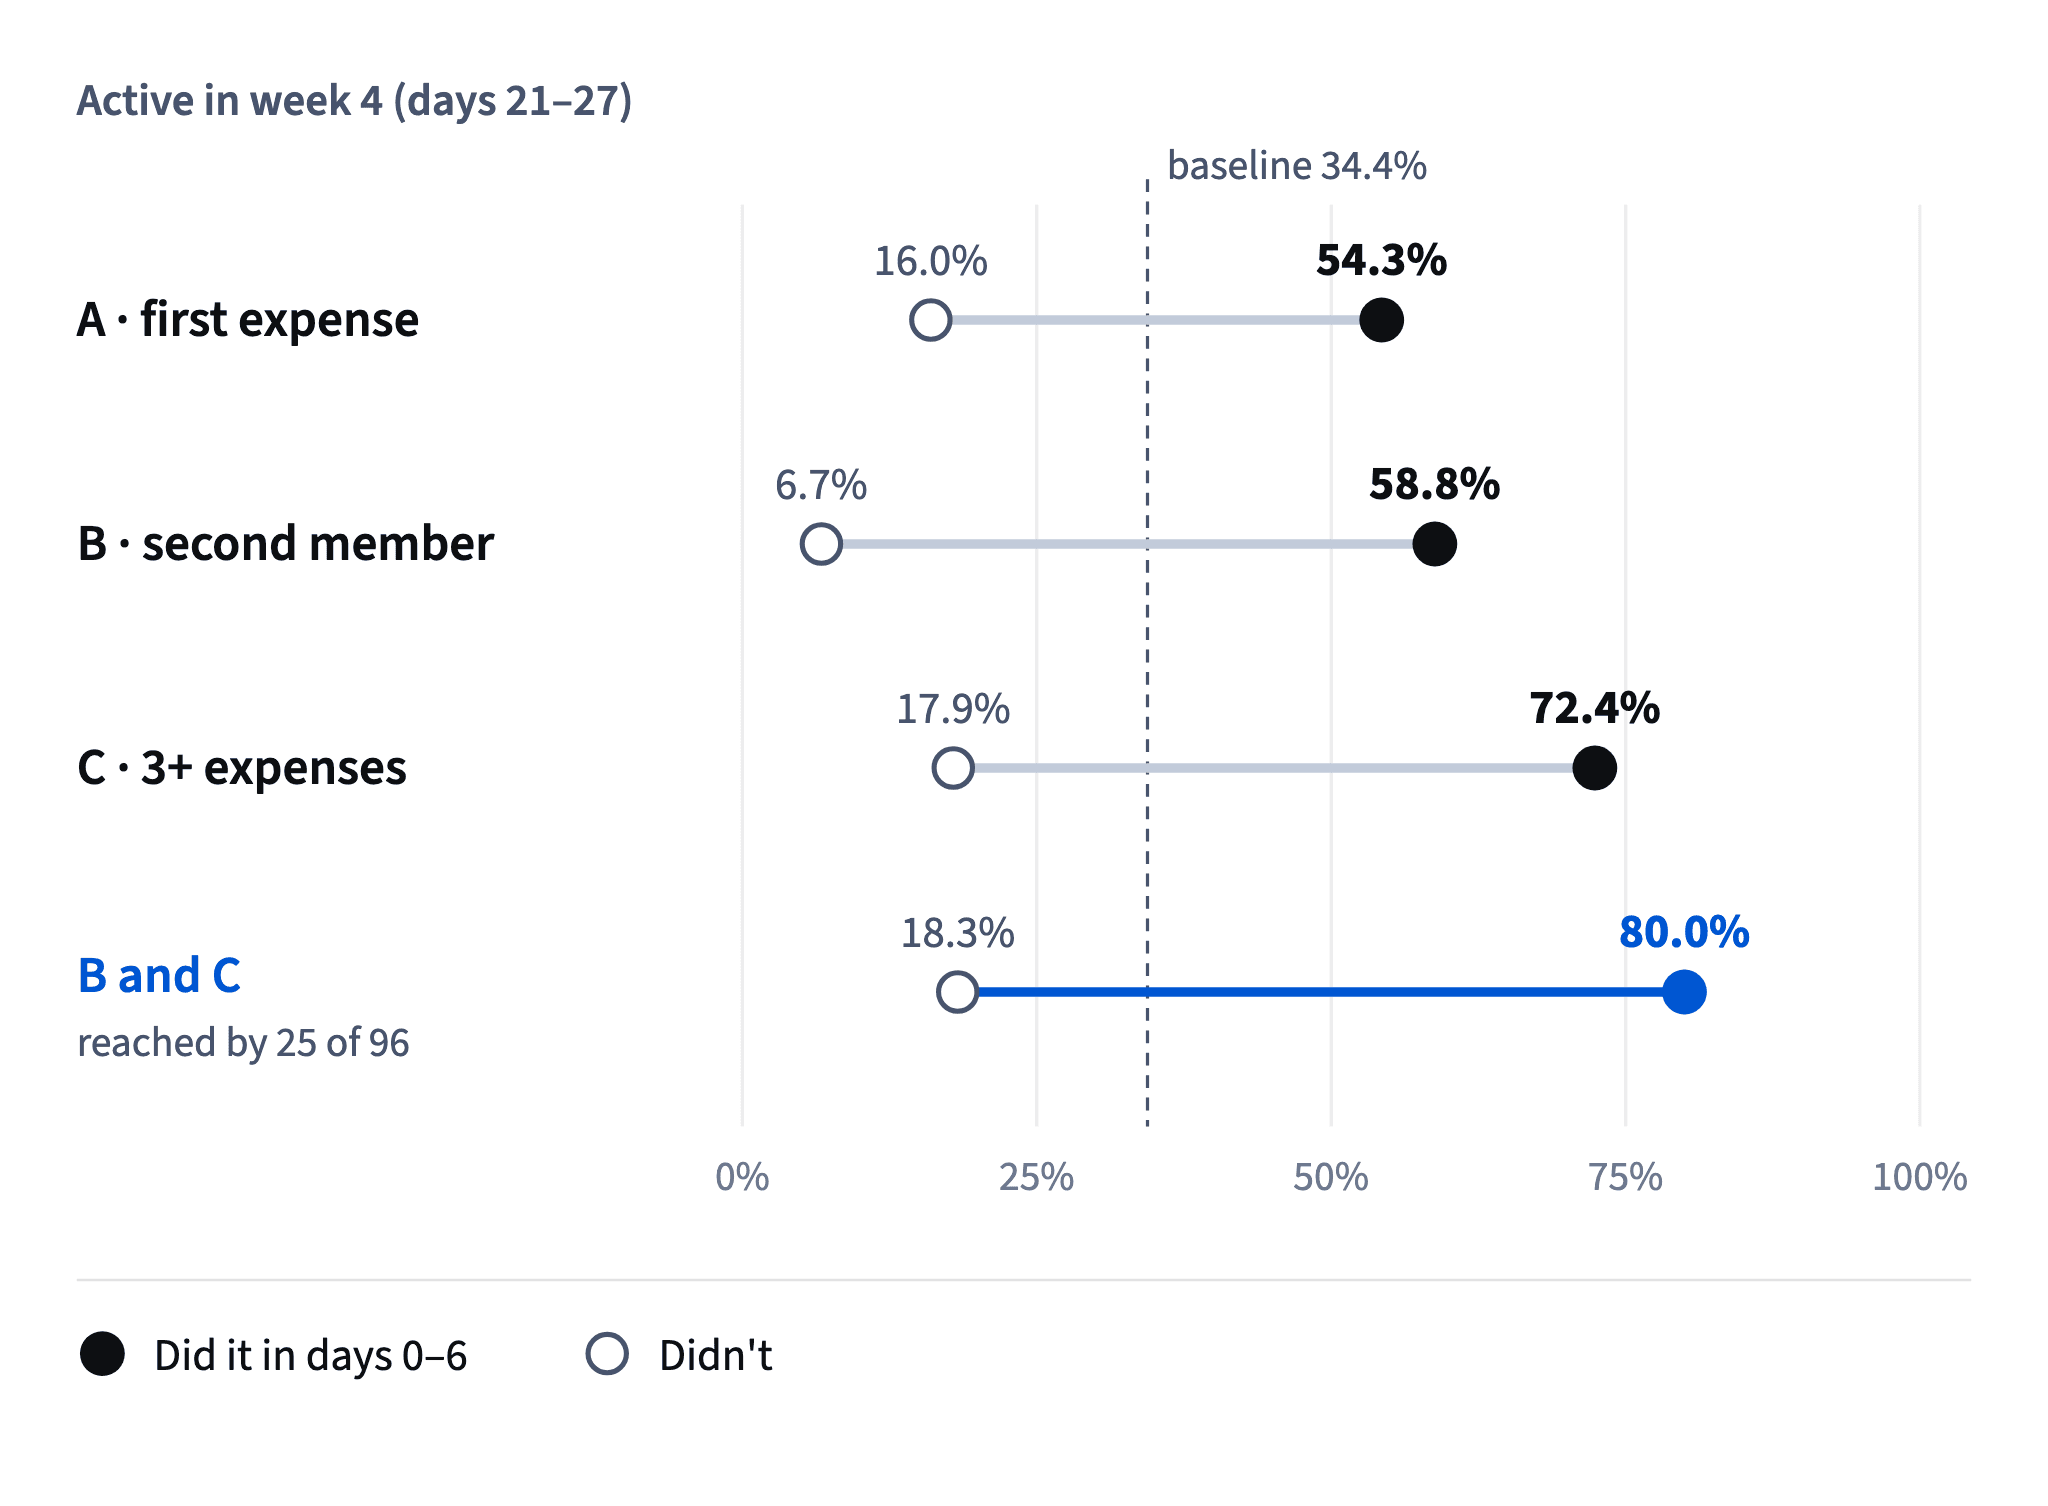
Compute every gap from the same baseline group, the 96 July users, with the same outcome, active in week 4. Mixing outcomes (week 2 for one candidate, week 4 for another) makes the ranking meaningless.
Notice who comes first: the narrowest criterion, met by only 26% of users. That's typical. Adding conditions keeps only the most committed users in the "did" group, which raises their retention whatever the action itself contributes.
So the ranking is the start of the decision, not the end. Read it next to reach, and remember that a gap is an association: users chose these actions, so the gap mixes what the action does with who chooses it.
- DoGaps on one scale: 61.7 > 54.5 > 52.1 > 38.3 points, all for week-4 retention.
- Don'tRank by ratio: second member 58.8 ÷ 6.7 ≈ 8.8× comes first.
Ratios explode when the “didn't” group is near zero; use points.
Reach: how many users a criterion covers
A ranking by gap is half the picture: every candidate also has a reach, the share of new users who meet it, and the two pull in opposite directions.
For the 96 July users:
Reach for 3+ expenses: 29 users have expenses_week1 ≥ 3, so 29 ÷ 96 ≈ 30.2%.
The table shows the trade-off. The sharper the criterion, the fewer users it covers. A criterion almost nobody meets is a poor onboarding target: the team can't move it much, and its high retention partly reflects how selective it is. A criterion almost everybody meets doesn't separate anyone.

Reach also tells you the room to grow. With 26% meeting the combined action, there are many users who could get there; with 95% meeting a criterion, there's little left to gain.
So report each candidate with both numbers. Choosing on the gap alone always picks the narrowest option.
- Do“3+ expenses: gap 54.5 points, reach 30.2% (29 of 96).”
- Don'tRank candidates by gap only and pick the top one.
The top of a gap ranking is usually the narrowest criterion.
Selection bias: who chose to do it
Selection bias is a gap between groups created by who ends up in each group, not by the thing being compared. When users choose an action themselves, the people who choose it can differ in ways that make them stay anyway.
Theo wants to push every new user to the combined action and promise 80% week-4 retention. In the Halves data the clearest difference between those who chose it and those who didn't is the channel:
- invitees reached the combined action far more often: 44% against 19% of self-signups;
- invitees who didn't reach it still kept 46.7% in week 4; self-signups who didn't kept 10.7%.
Invitees arrive because a friend already uses Halves with them. They'd retain well with or without the action, and they're over-represented in the "did" group. So part of the 80% is who these users are, not what the action did; pushing a solo user through the same steps won't give them a friend.

Whenever you compare "users who did X" with "users who didn't", say it: the groups chose themselves, so the gap is an association, not an effect. Module 6 looks at selection in depth.
- Do“Invitees retain 46.7% even without the action, so part of the 80% is selection.”
- Don't“Push everyone to the combined action and retention will hit 80%.”
Treats a self-chosen group's retention as the effect of the action.
Narrowing selection isn't removing it
Splitting by a known difference is a good move. Within self-signups alone, the combined action still separates users: 69.2% of those who did it were active in week 4 (9 of 13) against 10.7% of those who didn't (6 of 56). The gap survives without invitees, which makes the candidate more believable.
But not proven. Holding the channel fixed removes one source of selection. Self-signups who reached the action still chose to; they may have bigger groups, more shared costs or a flatmate ready to join. None of that is in the data, and each can lift retention on its own. And with 13 users in the "did" group, each person moves the rate by almost 8 points.
Only an experiment, an onboarding change shown to a random half of new users with the other half as control, shows how much pushing people to the action adds.
How it fits together: a criterion is an action plus a time limit, chosen on gap and reach, and read as an association until a test proves it. Next, Case: fix the onboarding funnel puts the module's tools to work.
- Do“Gap holds within self-signups (69.2% vs 10.7%, n = 13): a strong candidate to test.”
- Don't“Controlled for channel, so the action causes retention.”
One known difference removed; unknown ones remain.
Ready to practise?
Answer the lesson's exercises and earn 250 points the first time you finish it.
Start the exercises